This article explains how to analyze completion volume, participating users and
trend changes after key actions have data.
When to use
Use it after custom events have stable data to review completion volume,
participating users and trend changes for key actions.
Steps
-
Open Event Analysis and choose a key action that has been reported
consistently.
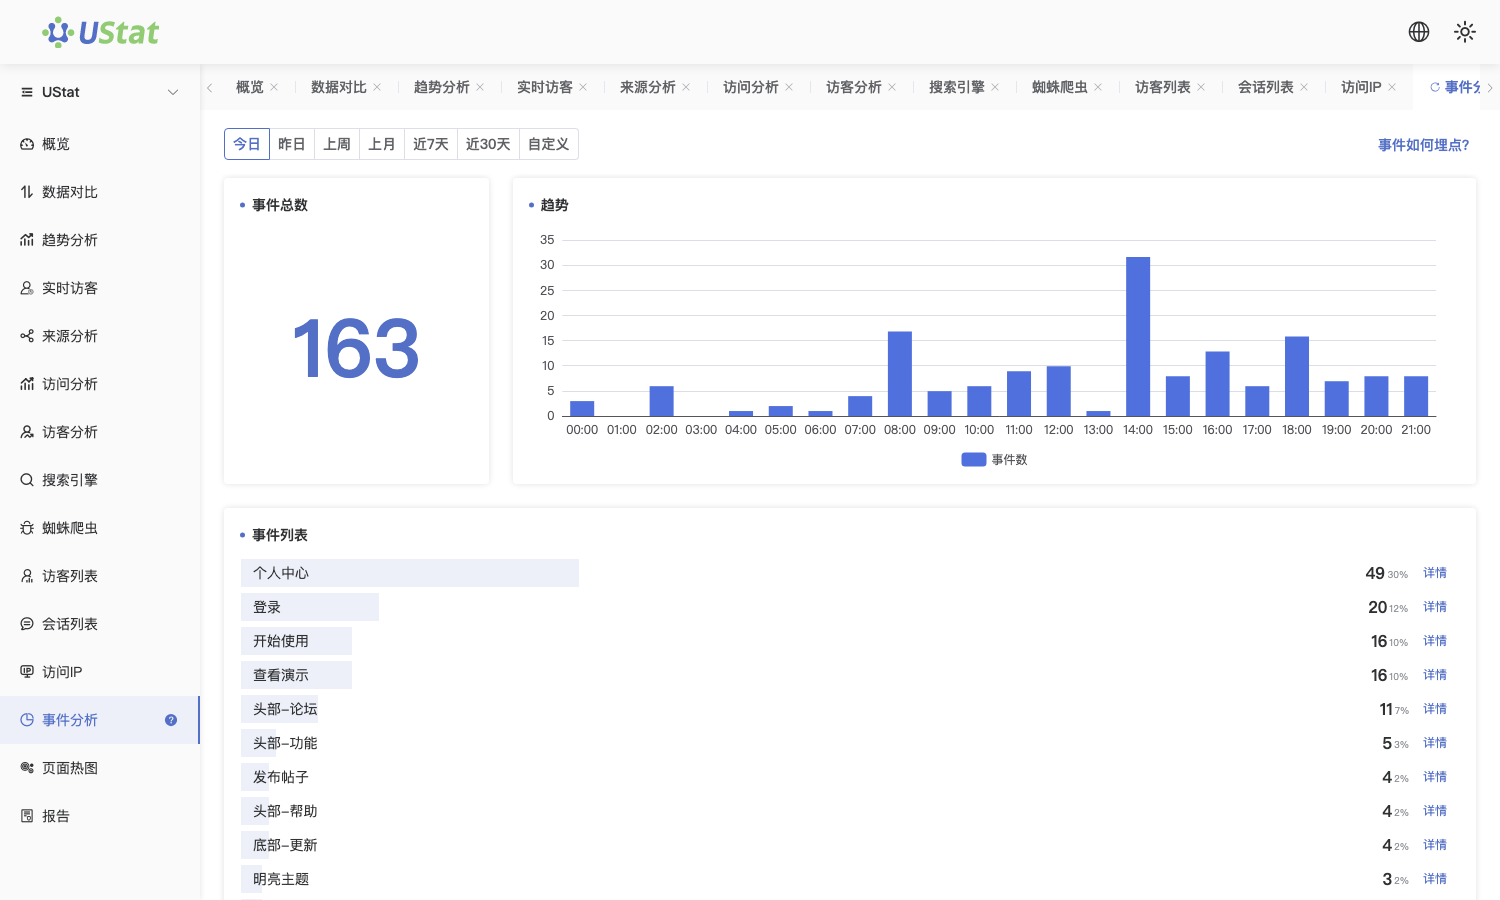
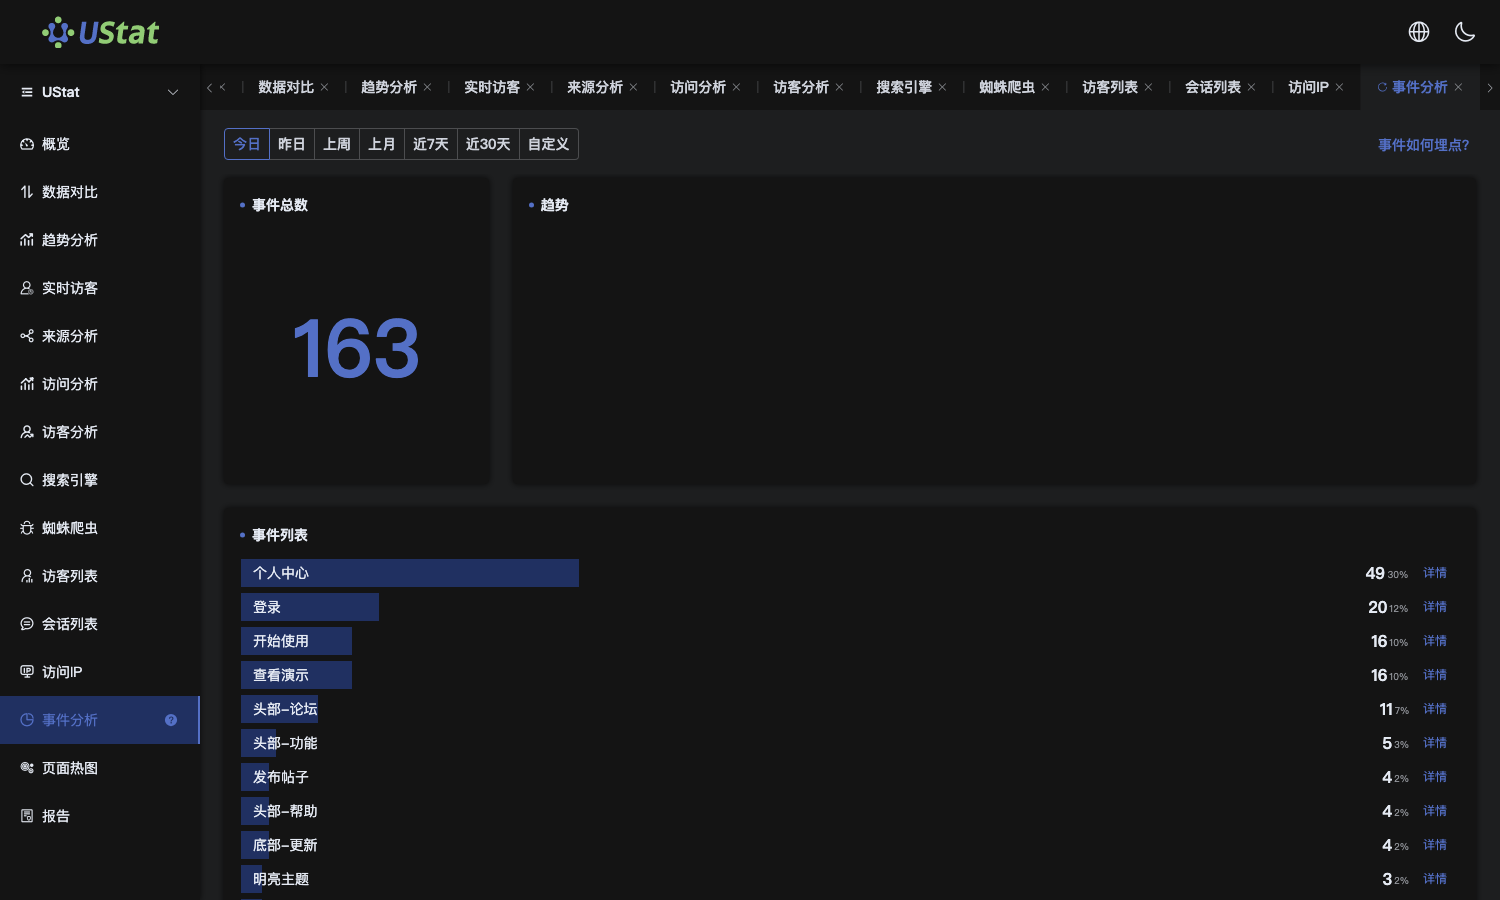 Interface example. Actual console display may vary.
-
Compare trigger count and participating users to judge whether the
action is repeated by a few people or reaches more visitors.
-
Switch time ranges to see whether campaigns, page changes or release
timing affect completion volume.
-
Break results down by page, source or device to find visit contexts that
lead to the target action more often.
Notes
-
This article reviews data that already appears in reports; it does not
explain front-end code integration.
-
If no records appear in the list, read "Custom event integration" first.