This article introduces how to read core metrics, trend summaries and overall site
status on Overview.
When to use
Use it for daily status checks or to decide whether you need deeper detail
analysis.
Steps
-
Open Overview for the site and confirm the current site and time range.
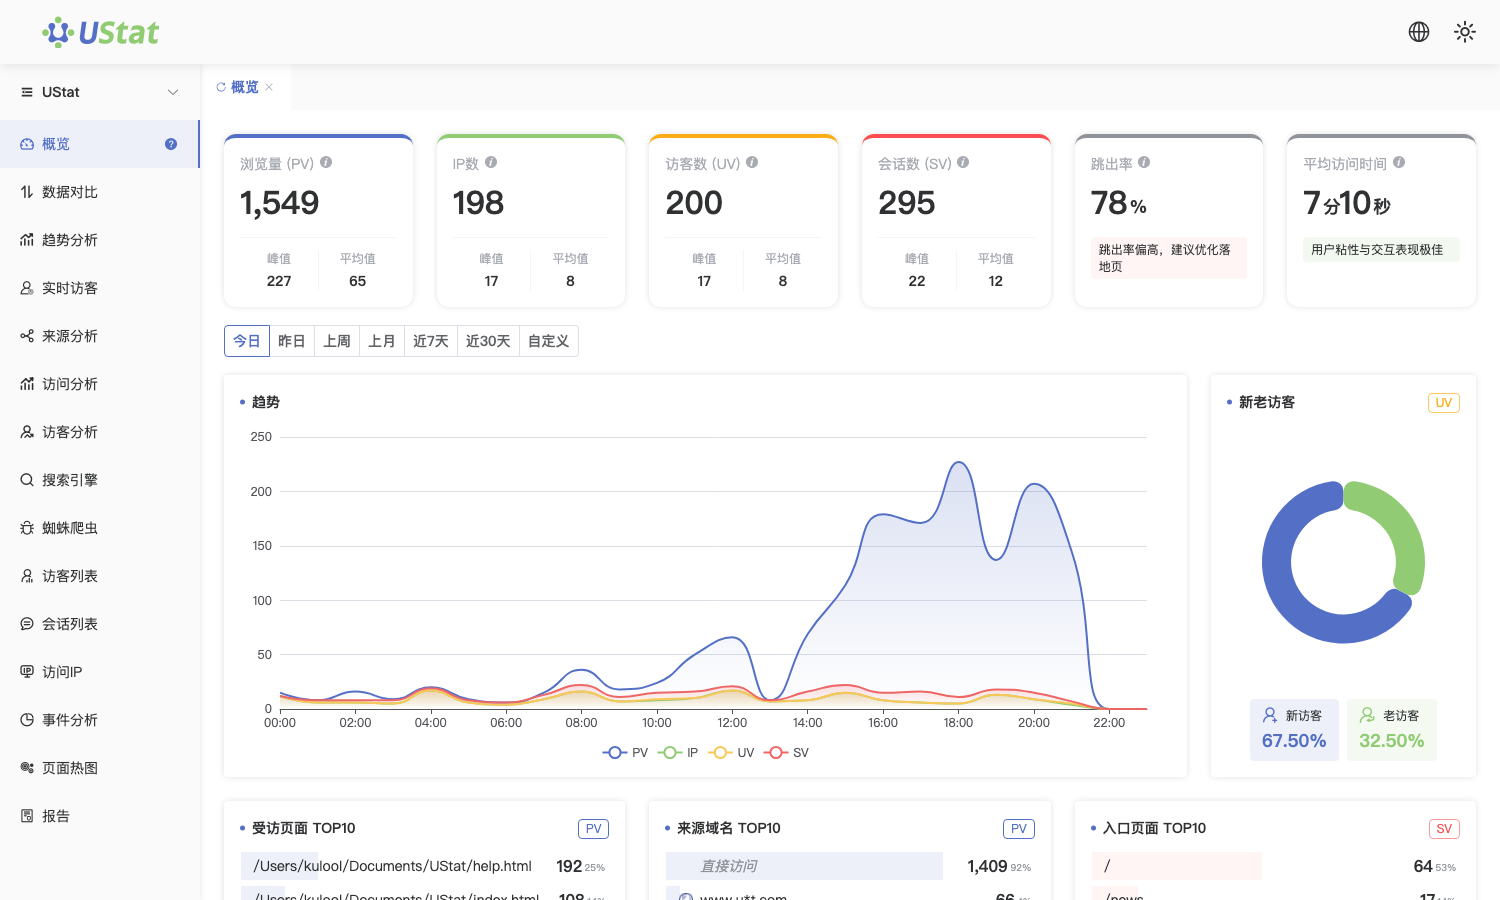
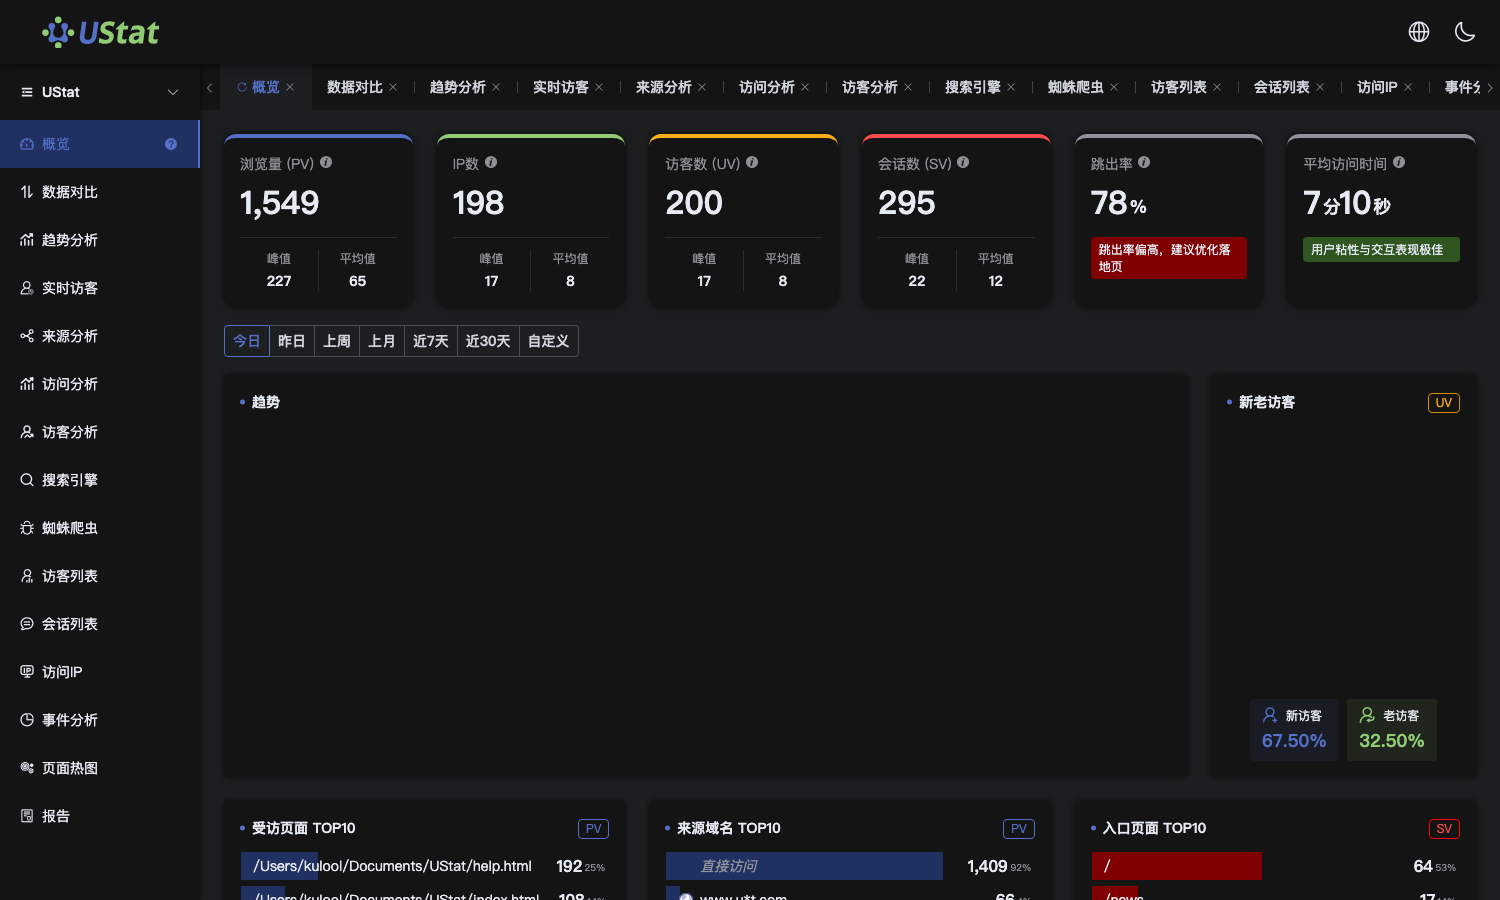 Interface example. Actual console display may vary.
-
Review top metrics to see whether traffic volume, visitor scale and
sessions move together.
-
Check trend summaries to see whether visits concentrate in a specific
time period.
-
If something looks abnormal, continue with Source Analysis, Visit
Analysis or Visitor Analysis.
Notes
-
Overview is best for quick detection, not a replacement for detail analysis.
-
Record the time range during reviews to keep future comparisons consistent.