趋势分析
📊 功能模块:趋势分析
📍功能入口:
登录 UStat 进入查看网站统计数据后,在左侧导航栏点击【趋势分析】,即可进入该模块。
🧩 功能介绍:
“趋势分析”模块提供按时间变化维度的深度流量趋势追踪,帮助用户分析网站在不同时间段、不同用户群体或设备类型下的访问行为。
该模块特别适合用来挖掘:
- 用户访问高峰/低谷时间段
- 新访客与老访客的行为差异
- 桌面端与移动端使用偏好
📄 页面结构说明:
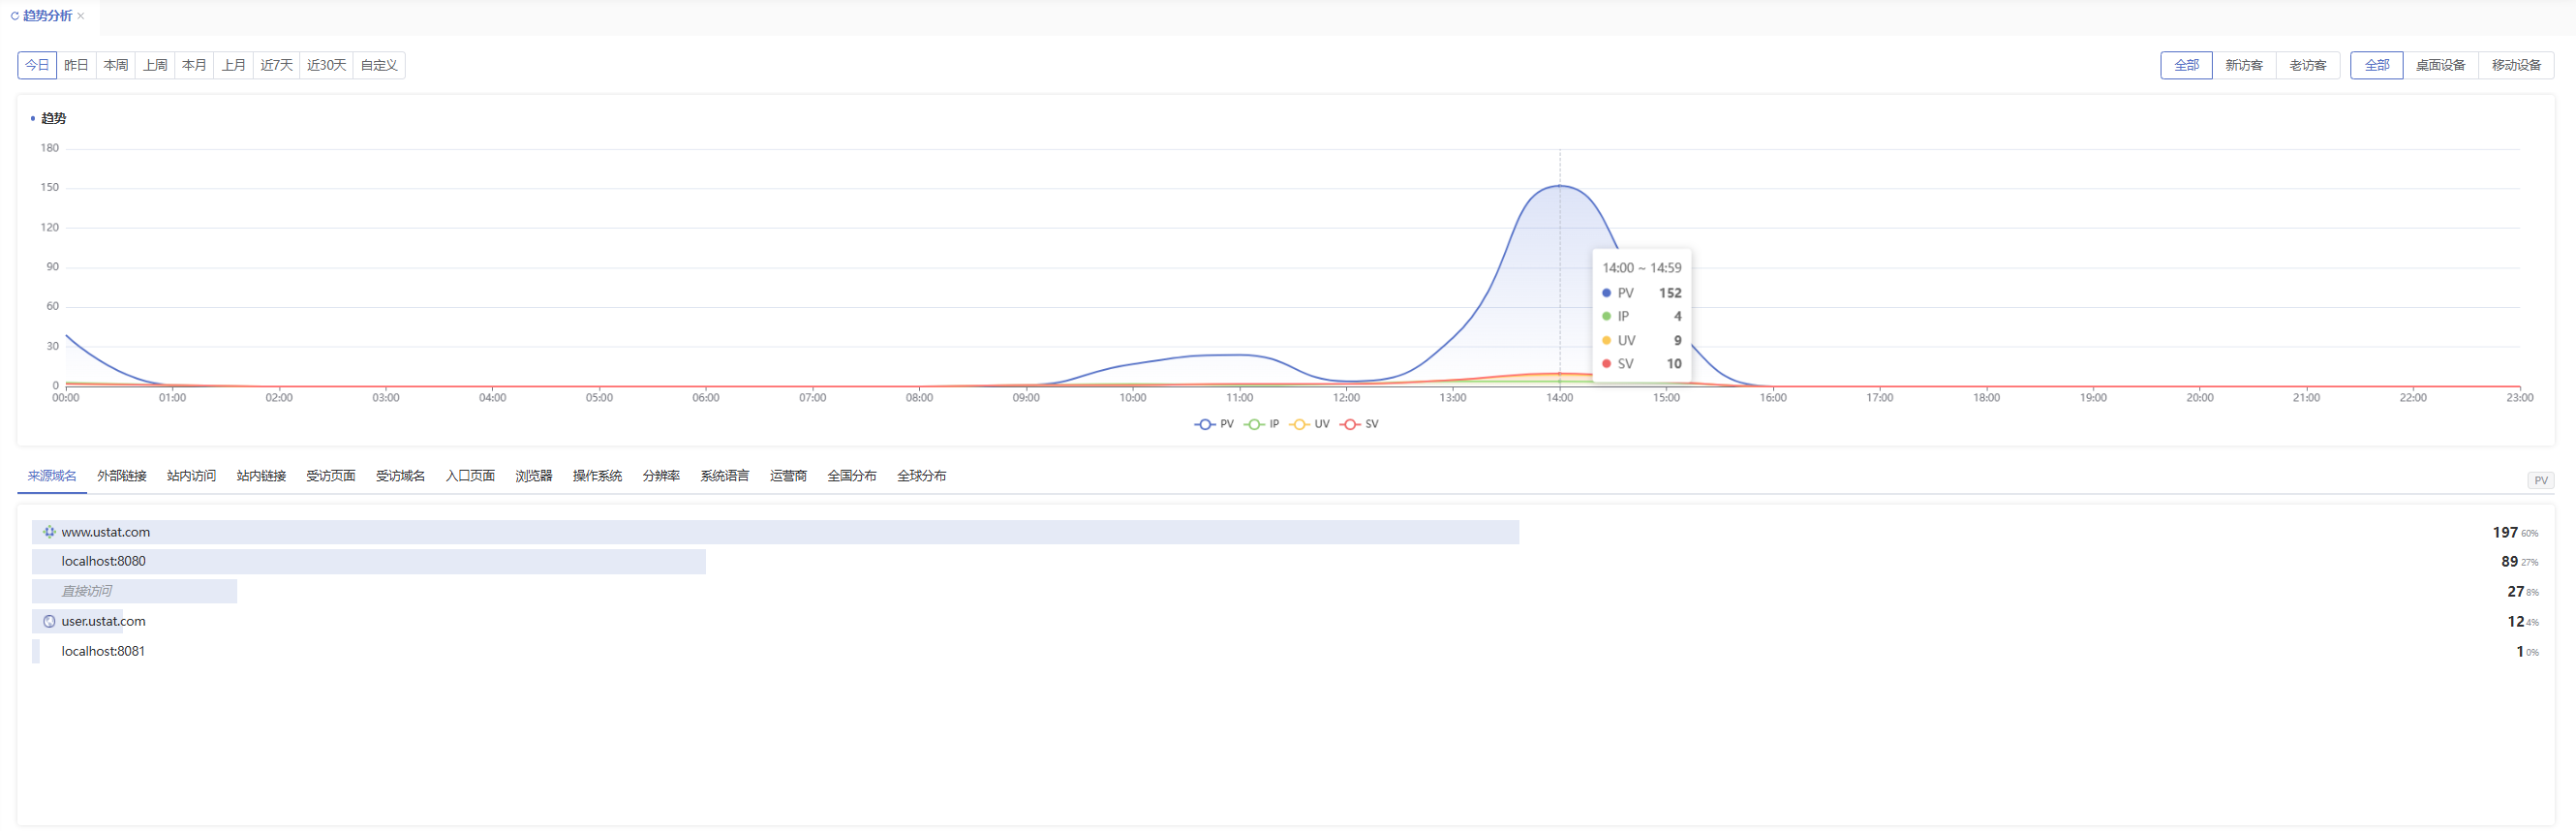
- 趋势曲线图区域(顶部)
- 图表默认展示当天的 PV、UV、IP、SV 四个指标随时间的变化趋势
- 可勾选多个指标进行对比展示,如:
- PV(页面浏览量)
- UV(访客数)
- IP(独立 IP 数)
- SV(会话数)
- 可选时间周期包括:
- 今日、昨日、本周、上周、本月、上月、近7天、近30天、自定义时间段
🕒 图表支持小时、天、周等粒度,适合分析访问高峰、节假日波动等现象。
- 用户类型与设备类型筛选
- 可选择仅查看“新访客”或“老访客”的访问趋势
- 也可切换查看“桌面设备”或“移动设备”的访问行为变化
- 筛选后,图表会实时更新,反映特定用户群体的行为趋势
📌 术语解释:新访客是指首次访问网站的用户,老访客是指过去已访问过的用户再次来访。
- 趋势明细表(底部)
- 展示按维度拆分的趋势对比数据(表格形式)
- 包括:
- 来源域名 / 外部链接 / 站内访问
- 受访页面 / 受访域名 / 入口页面
- 浏览器 / 操作系统 / 终端设备 / 分辨率
- 访客类型(新/老访客)、设备类型(桌面/移动)
- 地域分布(全国 / 全球)
⚙️ 可操作项说明:
- 可同时选择多个维度进行趋势图分析
- 可自由切换图表时间范围与用户群体
- 明细表可展开/折叠以便查看更详细数据
✅ 使用建议:
- 若网站近期内容更新频繁或进行了活动投放,建议通过“趋势分析”模块观察是否引发流量变化
- 可结合“新老访客切换”功能,评估用户留存效果
- 若移动设备趋势上升,可优化移动端页面体验
- 若某一来源渠道曲线明显异常(激增或断崖),可通过“来源分析”进一步排查原因