概览
📊 功能模块:概览
📍功能入口:
登录 UStat 点击查看网站统计数据后默认进入概览页。
🧩 功能介绍:
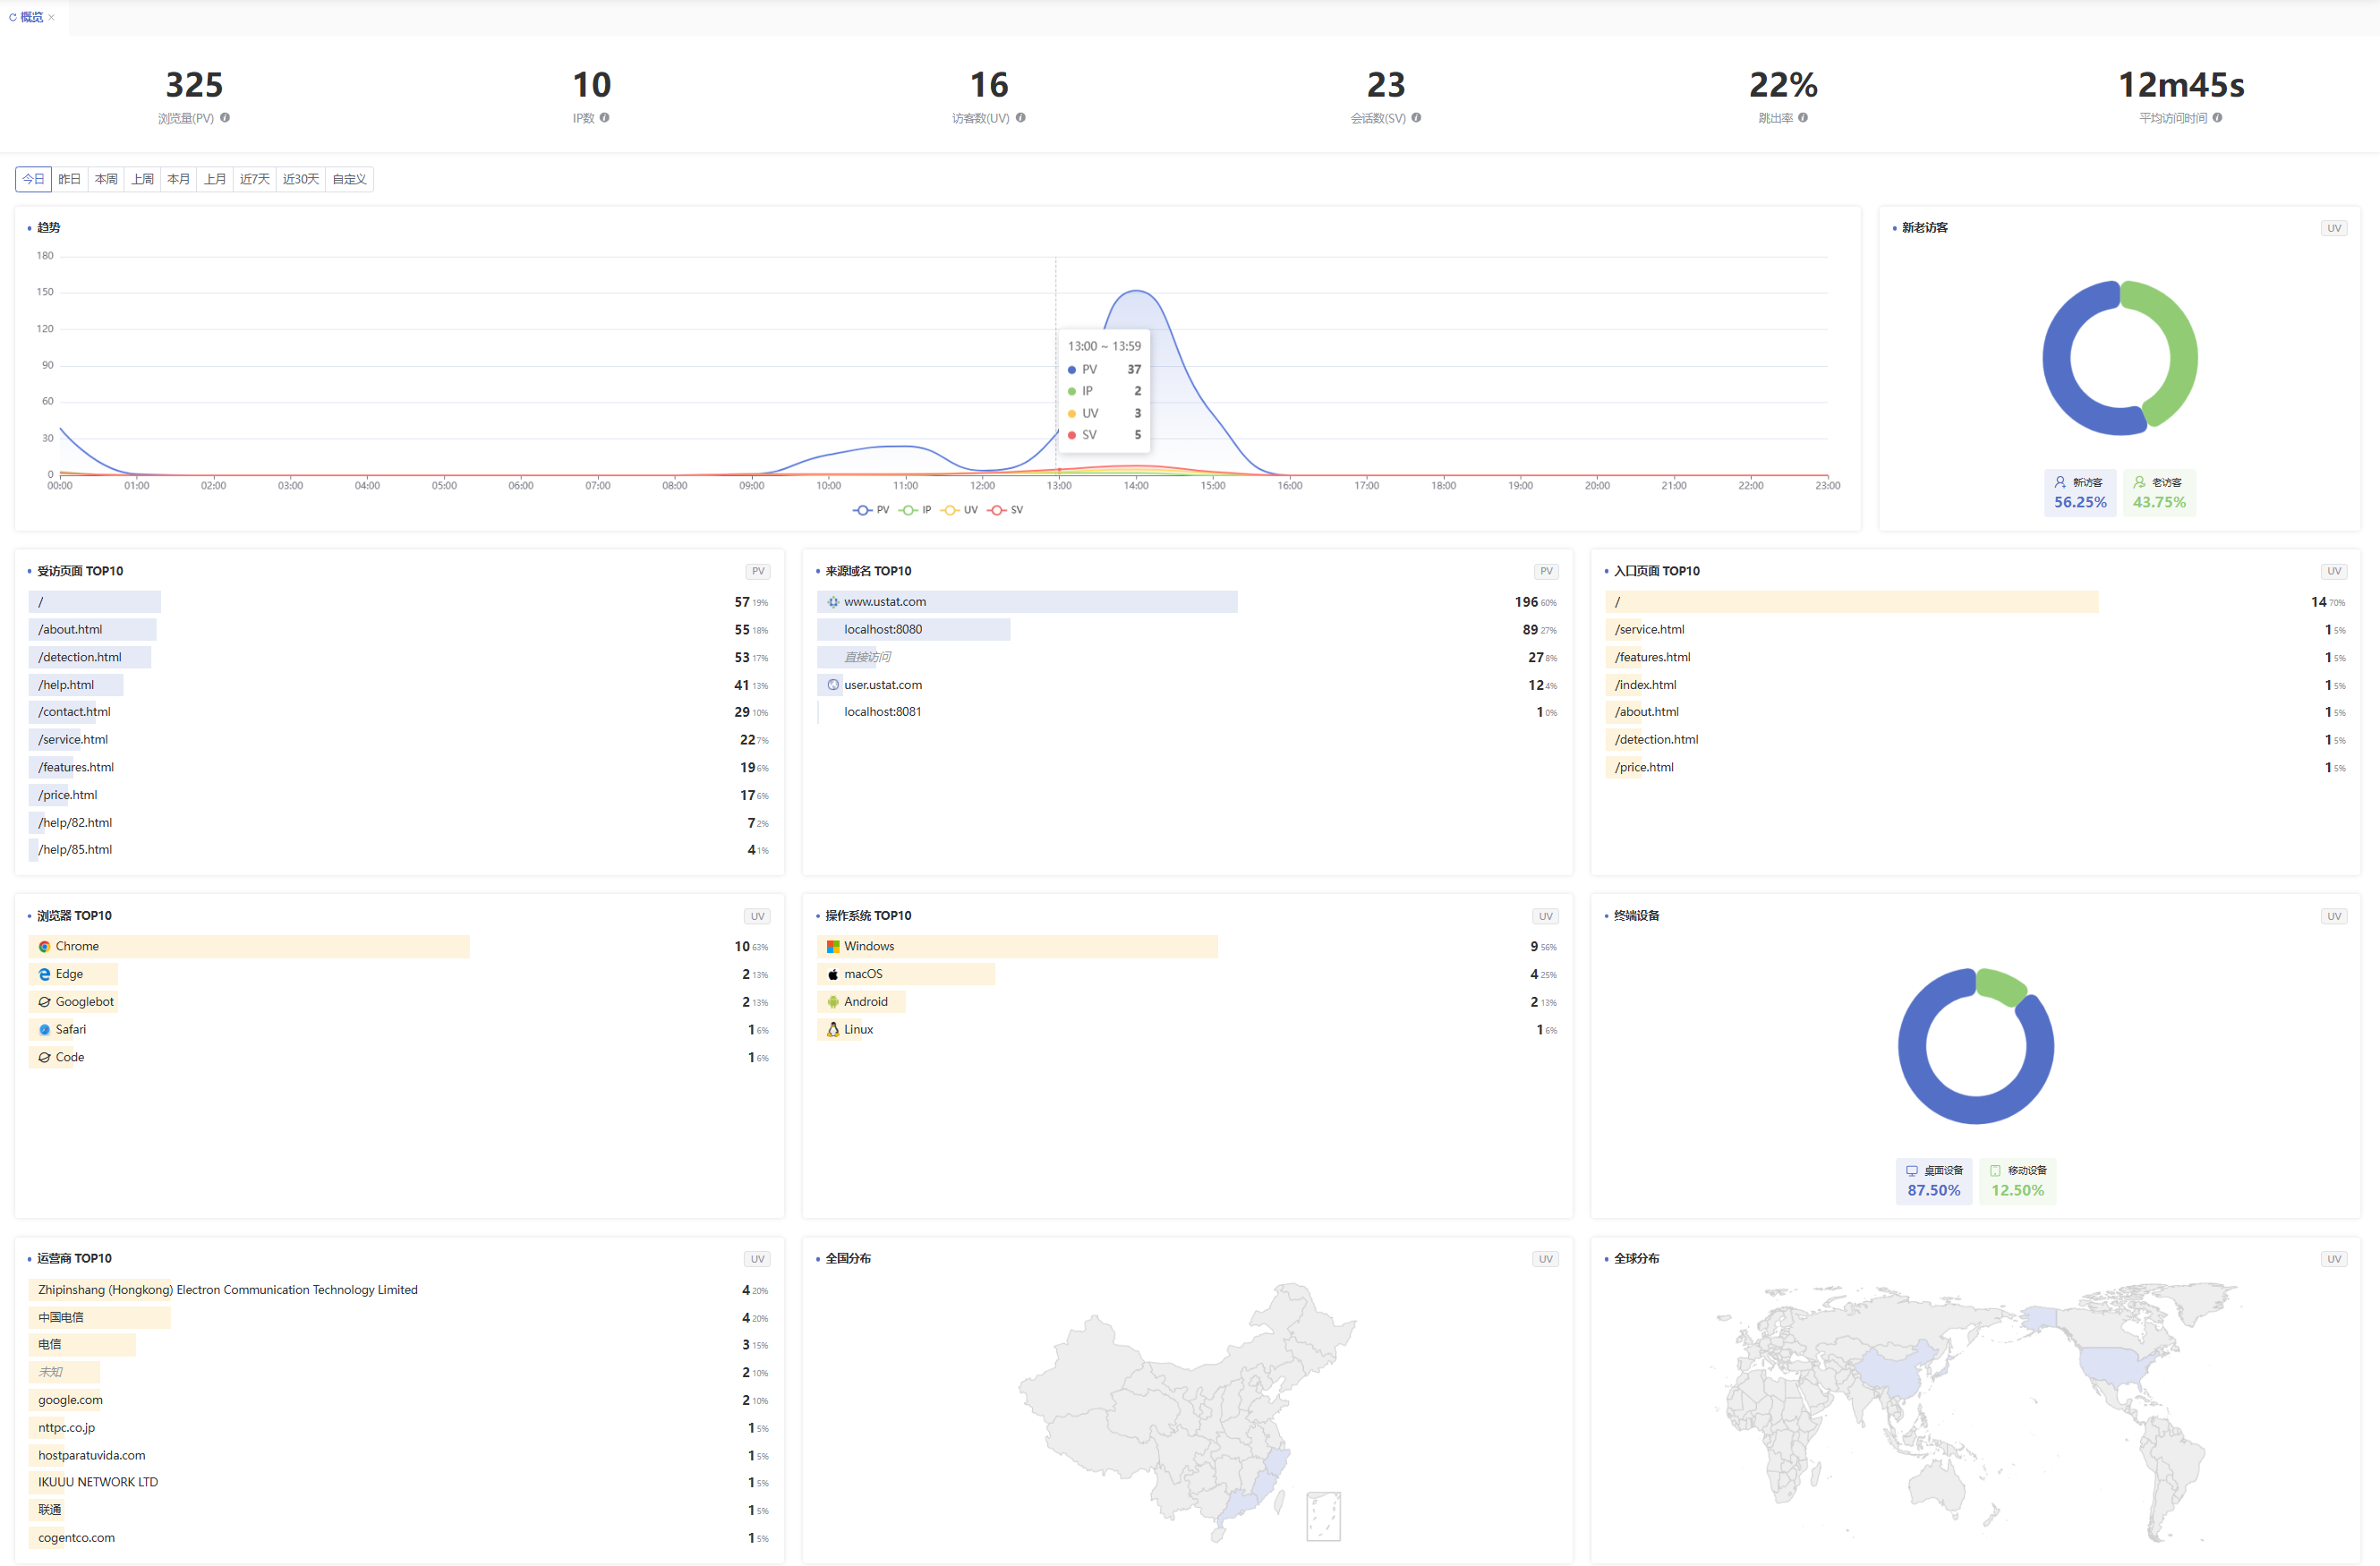
概览模块是 UStat 的核心功能之一,用于帮助用户快速了解网站的整体流量情况和访客构成。无论您是初次使用统计工具的新手,还是需要汇报数据的运营人员,这一模块都可以为您提供直观、丰富的数据支持。
📄 页面结构说明:
- 访问概况统计卡片(顶部)
展示今日的关键访问指标,包括:
- 浏览量(PV):网站页面被访问的总次数(即页面加载次数)
- 独立IP数:当日访问网站的独立 IP 数量
- 访客数(UV):不同访客的数量(基于浏览器或设备识别)
- 会话数(SV):用户访问网站的独立访问次数
- 跳出率:只浏览了一个页面就离开的网站访问占比
- 平均访问时长:每次会话中,用户在网站停留的平均时间
💡 术语说明:跳出率 = 只访问一个页面的会话数 ÷ 总会话数。
- 趋势图模块
默认展示当天的 PV、UV、IP、SV 四个指标的趋势曲线。您可以点击图表上方的选项切换时间周期:
- 支持查看:今日、昨日、本周、上周、本月、上月、近7天、近30天、自定义时间段
- 支持按单个指标分类展示
- 数据排行榜(TOP10)
展示访问最多的各类对象,帮助快速发现重点内容与主要来源:
- 受访页面 TOP10:访问量最多的网页列表
- 来源域名 TOP10:引导用户访问您网站的外部网站
- 入口页面 TOP10:用户首次进入网站时访问的页面
- 用户终端与属性分布
通过图表展示访客的设备和技术特征,包括:
- 浏览器使用 TOP10(如 Chrome、Safari、Edge)
- 操作系统 TOP10(如 Windows、iOS、Android)
- 终端设备类型(桌面设备 vs 移动设备)
- 访问地域分布
- 全国分布:中国大陆地区访客的地理位置(以地图形式显示)
- 全球分布:展示来自不同国家或地区的访客占比
⚙️ 可操作项说明:
- 所有图表和排行榜模块均支持时间周期切换
- 鼠标悬浮图表上可查看具体数值
✅ 使用建议:
- 每天登录后查看“概览”页面,可以快速了解网站是否有明显波动
- 结合 PV/UV/跳出率变化,可初步判断近期页面内容或渠道投放的有效性
- 关注 TOP10 榜单可及时发现访问热点或异常页面