
What is a website heat map? Detailed explanation of core concepts and principles
Time: 2026-08-30
Editor: USTAT.COM
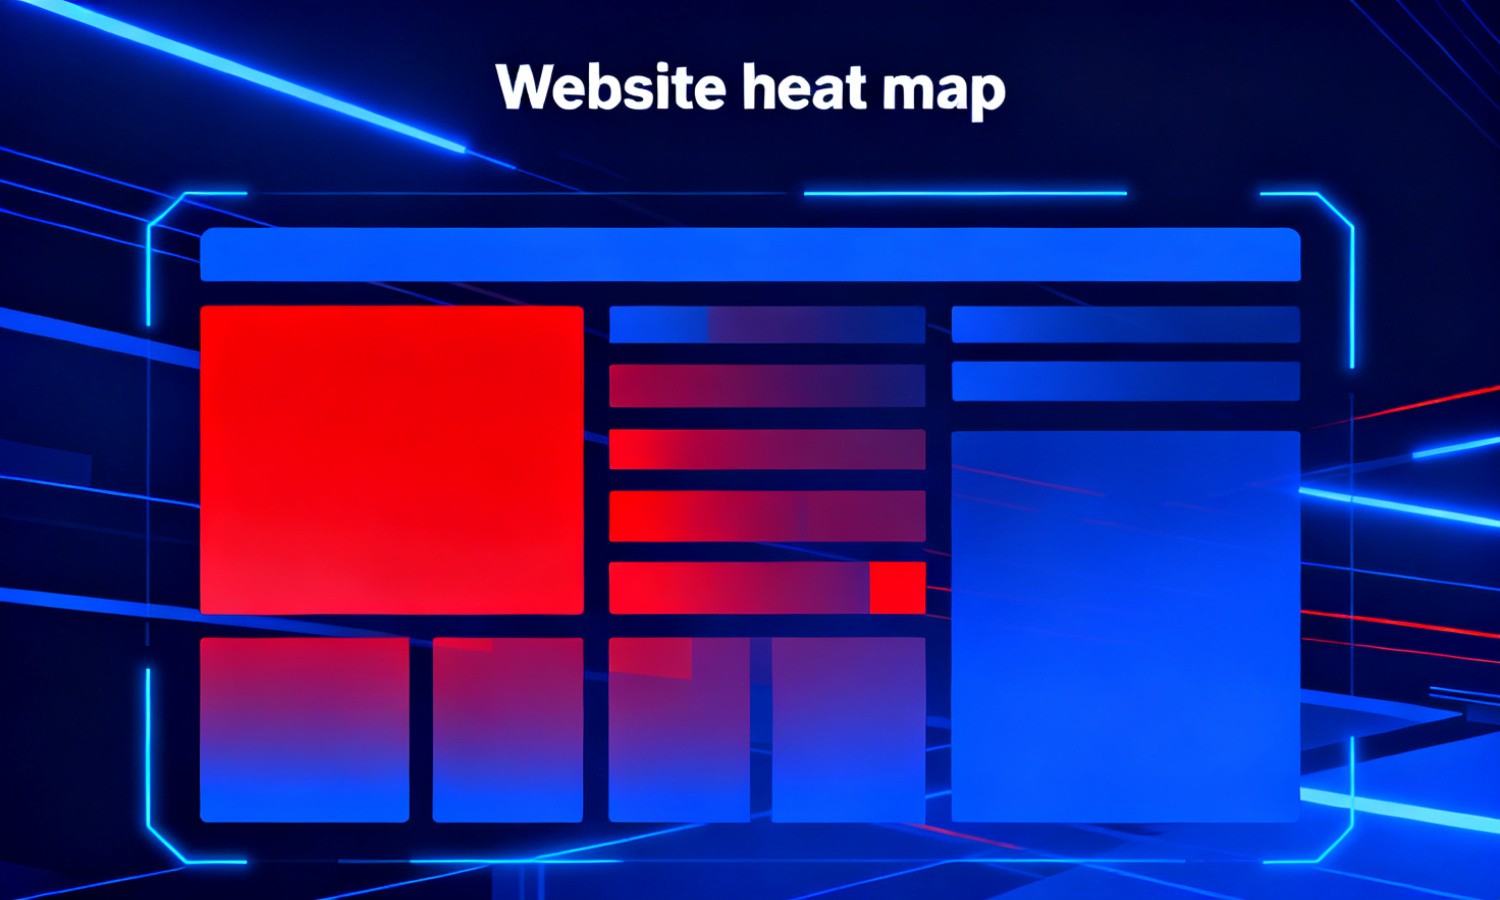
with the increasing cost of traffic acquisition, website operators need to accurately grasp the user's page behavior path in order to optimize the content layout and conversion path. Website heat map, as an intuitive user behavior analysis tool, is becoming one of the core bases for operational decision-making. This article will explain in detail from the core concepts, functional principles, practical applications and other dimensions to help readers fully understand this tool, learn to use it to mine user requests, and improve the operational efficiency and conversion effect of the website.
The core concept and classification of website heat map?
to understand the value of a website heat map, you first need to clarify its definition and common types, which is the basis for subsequent application methods.
1, core concept analysis
website heat map is a tool that visually displays user page behavior data through color depth changes. It converts users' clicking, staying, scrolling and other behaviors into intuitive heat distribution. The darker the color area represents the higher the user's attention and the more concentrated the behavior. This visualization allows operators to quickly capture the core focus area of the page, get rid of boring digital reports, and directly gain insight into user behavior preferences.
2, common types of classification
the current mainstream website heat map is mainly divided into three categories, namely click heat map, attention heat map and scrolling heat map. Click heat map records the user's mouse click position, which is often used to analyze the attractiveness of interactive elements such as buttons and links; attention heat map reflects the user's visual focus area through eye tracking or dwell time data; scrolling heat map shows the user's page scrolling depth, helping to judge the readability of the content and the rationality of the layout of key information.
What is the principle of the website heat map?
Behind the intuitive presentation of the heat map of thewebsite is a set of rigorous data collection and analysis logic. Understanding its principle can help us interpret the data more scientifically.
1, user behavior data collection
website heat map data collection mainly relies on the tracking code embedded in the page. When the user visits the page, the code will record various behavioral data of the user in real time, including click coordinates, dwell time, scrolling distance, mouse movement path, etc. These data will be uploaded to the analysis platform. After cleaning and sorting, it provides the original basis for subsequent heat map generation. The collection process runs in the background throughout the process and will not affect the normal browsing experience of the user.
2, data lake visualization conversion
after obtaining the original data source, the platform will weigh the data according to the preset algorithm, such as the more clicks and the longer the stay area, the higher the weight value. Then the weight value is mapped to different colors, usually red for high attention areas, yellow for medium attention, blue for low attention, and finally generate an intuitive website heat map. This conversion process not only preserves the accuracy of the data, but also lowers the threshold for data interpretation.
What are the core application scenarios of website heat map?
master the application scenarios of the website heat map, in order to truly implement this tool and bring practical value to the website operation.
1, page content layout optimization
through the website heat map, the operator can find the core content in the page that is ignored by the user, such as the key information originally placed at the bottom of the page, which may be missed due to the lack of user scrolling depth. At this time, this kind of content can be adjusted to the upper half of the user's attention to improve the information reach rate. At the same time, it can also analyze the click distribution of the navigation bar and sidebar, optimize the menu layout, and allow users to find the content they need more quickly.
2, conversion path efficiency improvement
for e-commerce websites or pages with conversion needs, the website heat map can help locate the conversion bottleneck. For example, when the user clicks on the Add to shopping cart button on the product details page are extremely low, click the heat map to see if the button position is inconspicuous, the color is not coordinated with the page, or there are other elements around that distract the user's attention, and then optimize the design and layout of the button to improve the conversion efficiency.
4. How to avoid the misunderstandings of website heat map?
although the website heat map value is significant, but in actual use, if it falls into a misunderstanding, it will lead to wrong operational decisions, so it is necessary to clear the direction of avoidance.
1, single data dimension decision
some operators only rely on the click data of the website heat map to make decisions, ignoring the behavioral path after the user clicks, such as the user clicks on a link to jump out immediately. At this time, high click volume does not mean that the element is valuable, but may be misleading. Therefore, it is necessary to combine the page stay time, bounce rate and other data comprehensive analysis to avoid one-sided judgment.
2, ignoring sample data representativeness
website heat map analysis results rely on sufficient sample data. If only a small number of users are collected, the resulting heat distribution may be accidental and cannot represent the behavioral preferences of the overall users. Therefore, when using it, it is necessary to ensure that the data sample size reaches a certain scale, and at the same time distinguish the heat map data of different client bases, such as the behavioral differences between new and old users, to avoid generalization.
To sum up, website heat map is a complete user behavior analysis system from data collection to visual presentation, and then to decision-making application. It can help operators get rid of subjective judgments and optimize website layout and transformation paths with data-driven. In actual use, it is necessary to master its core concepts and classifications, understand data collection logic, identify application scenarios, and avoid misunderstandings such as single-dimensional decision-making and insufficient samples in order to truly play the value of website heat map and improve the user experience and operational efficiency of the website.